EXECUTIVE SUMMARY
INTRODUCTION
The City of West Jordan (City) is one of the largest cities in the State of Utah and is continuing to grow. The City desires to develop an updated master plan for its water system in order to adequately plan for the future. The water master plan identifies recommended improvements that resolve existing and projected future deficiencies in the water system throughout the City's service area. An implementation plan is then presented to complete the most pressing projects over the next ten years. This executive summary has been prepared to provide decision makers and the public with a summary of the evaluation process and information on all the major conclusions and recommendations. The full report provides additional technical details for City engineering and operations staff.
DEMAND PROJECTIONS
Through the planning window of this study (2060), the City is expected to see significant growth as the City approaches buildout. The United States Census Bureau estimates the population of the City to be approximately 117,000. The Wasatch Front Regional Council (WFRC), which provides population and employment projections, projects that the West Jordan area will increase of nearly 27,000 people from current. Over the past 15 years, the City's population has grown at approximately 1.8% per year. It is assumed that growth will continue at this rate in the near term before slowing as the City approaches buildout.
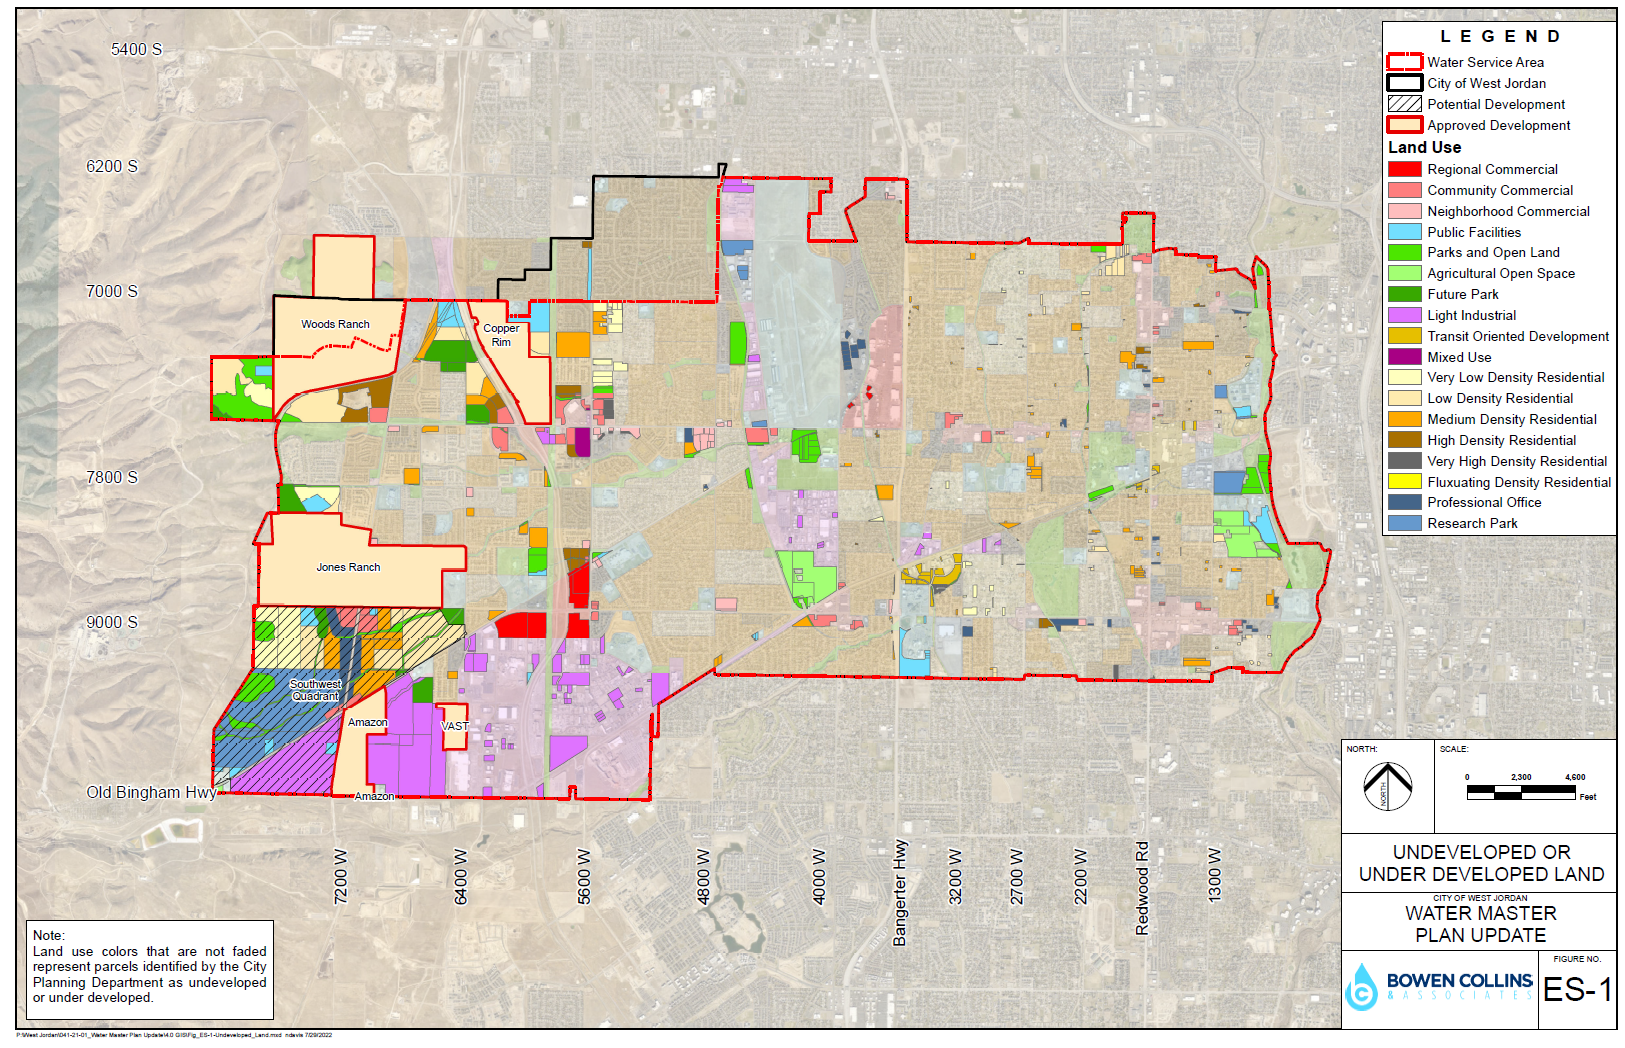
To determine where that growth will occur, City staff provided GIS data detailing undeveloped parcels. That information was combined with the City's current land use map to create a guide for where and how much water demand would increase. Figure ES-1 shows the undeveloped parcels with their assigned land use type, as well as several known developments that will be constructed in the near future.
To plan for water demand, population and employment projections are converted into a common unit, an equivalent residential connection (ERC). An ERC is defined as the equivalent water demand for the average residential water connection. As part of this study, Bowen Collins & Associates (BCA) worked with City staff to determine appropriate ERC densities for various residential and non- residential land use categories. Table ES-1 is a summary of the developable land available and the assumed ERC density associated with it. Based on this analysis, at buildout the water system will have 24,274 additional ERCs. It should be noted that any changes in land use or density assumptions can have significant impacts on the water system. Each ERC has an associated water source, pumping, conveyance and storage capacity associated with it.
Land Use Category | Developable Acreage | Assumed Density (ERC/Acre) | Additional ERCs |
Land Use Category | Developable Acreage | Assumed Density (ERC/Acre) | Additional ERCs |
Generally Established Densities | |||
Community Commercial | 109 | 2.2 | 239 |
Neighborhood Commercial | 54 | 1.8 | 98 |
Parks and Open Land | 341 | 2.1 | 716 |
Professional Office | 102 | 2.6 | 265 |
Public Facilities | 176 | 2.4 | 423 |
Regional Commercial | 3 | 1.9 | 6 |
Research Park | 352 | 1.5 | 529 |
Transit Oriented Development | 39 | 20.0 | 773 |
Very Low Density Residential | 211 | 2.0 | 421 |
Low Density Residential | 317 | 3.0 | 950 |
Medium Density Residential | 331 | 5.4 | 1,784 |
High Density Residential | 46 | 8.0 | 365 |
Very High Density Residential | 16 | 16 | 258 |
Jones Ranch | 610 | 4.9 | 2,960 |
Copper Rim | 177 | 3.5 | 618 |
Woods Ranch | 193 | 4.7 | 912 |
Variable Density | |||
Light Industrial | 632 | 3.1 | 1,984 |
Interchange Overlay Zone | 375 | 29.3 | 10,974 |
TOTAL | 24,274 | ||
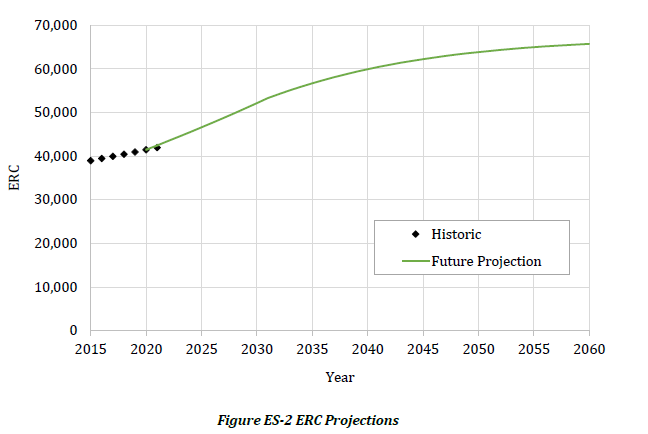
Based on historic ERC counts and City Staff's tracking of planned developments over the past several years, it is estimated that in 2021 the City had an existing ERC count of 41,976. Adding the current and projected ERCs gives a buildout projection of 66,250. Figure ES-2 shows the expected increase in ERCs over time.
PRODUCTION REQUIREMENTS
The State of Utah Division of Drinking Water recently conducted an analysis of the City's water usage of the past 3 years. The result of this analysis was a System-Specific Minimum Sizing letter that sets source requirements for average annual demand, peak day source demand and storage sizing as follows:
• Average Annual Demand = 237,250 gallons per ERC
• Peak Day Source Demand = 1,764 gallons per day per ERC
• Minimum Equalization Storage = 650 gallons per ERC
These sizing standards have been used for this analysis. The State will review the City's water usage and adjust these requirements every few years. These updates will take into account actual water usage which may be affected by conservation efforts, drought, or other factors. It should be noted that the production requirements of the State include a "variability factor" above and beyond actual historical use. This helps assure that water supply is available regardless of the variability of actual demand.
Production requirements have been compared to source availability to determine if City supplies are adequate to meet existing and future demands. The results of this analysis are summarized in a series of table below. Included in the tables is the following information:
• Projected future demands
1
. It will be noted that this is not a single value for any given year, but a range. As has been seen in the historical data, demand can vary significantly from year to year depending on weather conditions and other factors. The range shown incorporates the maximum and minimum per ERC water use in the historic record.
• Source sizing requirement based on the State of Utah minimum requirement.
• Source capacity. The City has two main sources of water: City-owned wells and water purchased from the Jordan Valley Water Conservancy District. These sources provide the City with 26,500 acre-ft/year of supply at a peak production rate of about 78 million gallons per day.
Results are summarized in Tables ES-2 through ES-5. Table ES-2 shows the projected annual demand and Table ES-3 shows the projected peak day demand through 2060. Table ES-4 shows the projected annual peak day supply compared with demand through 2060 and Table ES-5 shows the same comparison for peak day.
Year | Projected Water Demand (Acre-Ft/Yr) | State Sizing Requirement (Acre-Ft/Yr) | |
Low Estimate | High Estimate | ||
Year | Projected Water Demand (Acre-Ft/Yr) | State Sizing Requirement (Acre-Ft/Yr) | |
Low Estimate | High Estimate | ||
2021 | 21,600 | 25,600 | 29,000 |
2026 | 24,300 | 28,300 | 32,200 |
2031 | 27,000 | 31,000 | 35,500 |
2041 | 29,600 | 33,600 | 38,600 |
2051 | 30,900 | 34,900 | 40,300 |
2060 | 31,200 | 35,200 | 40,700 |
Year | Projected Water Demand (MGD) | State Sizing Requirement (MGD) | |
Low Estimate | High Estimate | ||
Year | Projected Water Demand (MGD) | State Sizing Requirement (MGD) | |
Low Estimate | High Estimate | ||
2021 | 41 | 59 | 75 |
2026 | 47 | 65 | 82 |
2031 | 54 | 72 | 90 |
2041 | 60 | 78 | 98 |
2051 | 63 | 81 | 102 |
2060 | 63 | 81 | 102 |
1
It should be noted that both projected demands and the State sizing requirement have been projected assuming that the City can successfully achieve the State of Utah Regional Conservation goal. This includes a reduction in per capita water use from 198 gallons per day (gpd) in 2020 to 183 gpd in 2030 and to 166 gpd in 2065.
Year | JVWCD Contract (Acre-Ft/Yr) | JVWCD Contract - Extra 20% (Acre-Ft/Yr) | Well Production (Acre-Ft/Yr) | State Sizing Requirement (Acre-Ft/Yr) | Surplus / (Deficit) (Acre-Ft/Yr) |
2021 | 20,000 | 4,000 | 2,500 | 30,800 | (4,300) |
2026 | 34,000 | (7,500) | |||
2031 | 37,200 | (10,700) | |||
2041 | 40,300 | (13,800) | |||
2051 | 41,900 | (15,400) | |||
2060 | 42,300 | (15,800) |
Year | JVWCD Contract (MGD) | Well Production (MGD) | State Sizing Requirement (MGD) | Surplus / (Deficit) (MGD) |
2021 | 70.5 | 7.1 | 74.6 | 3.0 |
2026 | 82.3 | (4.7) | ||
2031 | 90.2 | (12.6) | ||
2041 | 97.7 | (20.1) | ||
2051 | 101.6 | (24.0) | ||
2060 | 102.4 | (24.8) |
As can be seen in Tables, the City has enough annual supply to satisfy projected demands for the next few years. However, it does not have enough redundant supply to meet the State sizing standard with its current variability factor. It is recommended that the City explore options for gradually increasing its annual supply. At a minimum, the City will need to have access to additional supply no later than 2024 when its projected demand will exceed available supply, even without the recommended redundancy factor. There are a couple options to consider for future source capacity as demand increases. This includes increasing the City's JVWCD contract, moving large outdoor watering locations to secondary water, increasing conservation efforts, or increasing well capacity. Increasing well capacity may be limited due to groundwater quality and availability concerns.
Source capacity looks a little better as shown in Table ES-5. Even with the current variability factor, the City has adequate production capacity to meet needs through at least 2025. When compared to actual demands, existing sources are expected to be adequate to meet demands through 2045. Since peak demands have been trending downward in recent years, it is recommended that the City wait on developing additional peak day capacity as it monitors demand trends over the next few years. If the City continues its current trend, it may not be necessary to add peak day capacity for several decades.
Loading...