Chapter Ten
WATER USE & PRESERVATION
WATER USE & PRESERVATION
The Salt Lake Valley is located in a semi-arid climate and receives approximately 20.49 inches of precipitation per year. As the second driest state in the nation, Utah places a high value on water and its conservation.
Over the past decade, the snowpack in the mountains surrounding the Salt Lake Valley has been slowly declining due to warmer-than- average temperatures and shifting weather patterns reducing the amount of water available for urban development. At the same time, the Salt Lake Valley has experienced tremendous growth, placing greater demand on the water supply and City infrastructure.
To conserve water resources statewide, in 2022, the Utah State Legislature passed Senate Bill 110, requiring cities to add a Water Use and Preservation element to its General Plan and meet several required water use preservation standards that are addressed below. This chapter has been developed to provide a general overview of the City’s water resources, establish policies and goals to help conserve water and meet State requirements.
Approximately 80% of the water distributed to the southwestern portion of the Salt Lake valley, which includes West Jordan, comes from the Jordanelle Reservoir and Deer Creek Reservoir, as well as smaller reservoirs at the headwaters of the Provo River. The remaining 20% of the water comes from groundwater wells scattered throughout the Salt Lake valley. This water is treated by the Jordan Valley Water Conservancy District and then sold to West Jordan for distribution.
Over the past 10 years, an average of 87% of West Jordan’s water was supplied by the Jordan Valley Water Conservancy District. An average of 10% came from underground wells scattered throughout the city, while the remaining 3% was untreated secondary water.
West Jordan has purchased additional water shares from the Jordan Valley Water Conservancy District in anticipation of increasing demand. More specifically, the amount of water shares has consistently remained above demand and has steadily grown at an average rate of 2% per year, as shown in the following graph. Despite this increase in water supplied to West Jordan, these facts should not be misconstrued to conclude that the Jordan Valley Water Conservancy District has a surplus in supply. To the contrary, the total amount of water shares granted by the Jordan Valley Water Conservancy District has actually grown increasingly close to their total supply threshold over the past two decades. This means that they can technically offer some shares presently, but their ability to do so will be much more limited in the future based on reservoir levels and the effect of water conservation efforts. On the other hand, water demand has followed a different trend by falling during the first half of the past decade, then rising in the second half. Since its low point a few years ago, water demand has increased at an average annual rate of 6% per year since 2017. As of 2020, water supply continues to remain higher than demand.
Nearly all of the water supplied to West Jordan is culinary water used for indoor or outdoor application. Most of the water connections in West Jordan serve residential land uses, which have been increasing steadily since 2010. These types of connections account for an estimate of roughly 90% of all water connections throughout the City. Non-residential water connections comprise the remaining 10%. Much of this water infrastructure growth is similar to the trends of new residential building permits issued over the past decade, which have also been increasing.
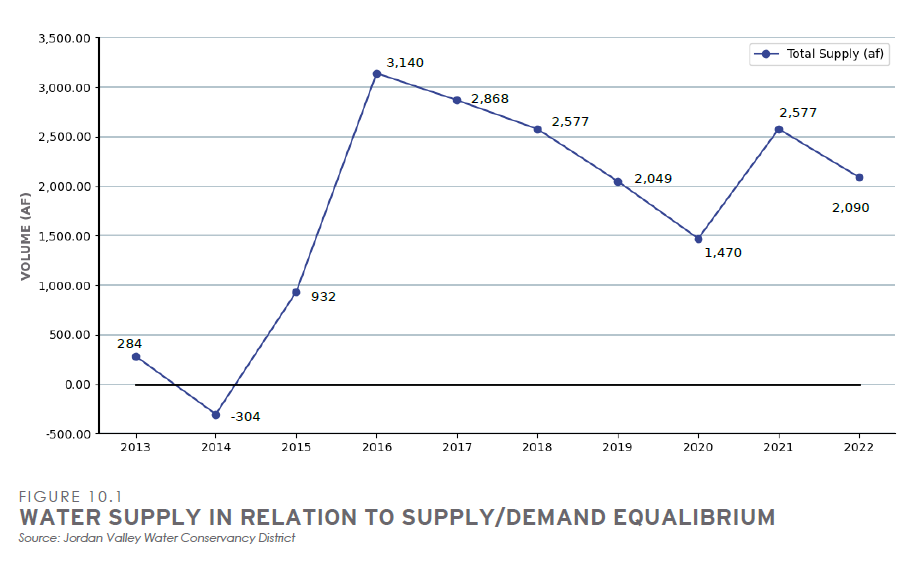
Source: Jordan Valley Water Conservancy District
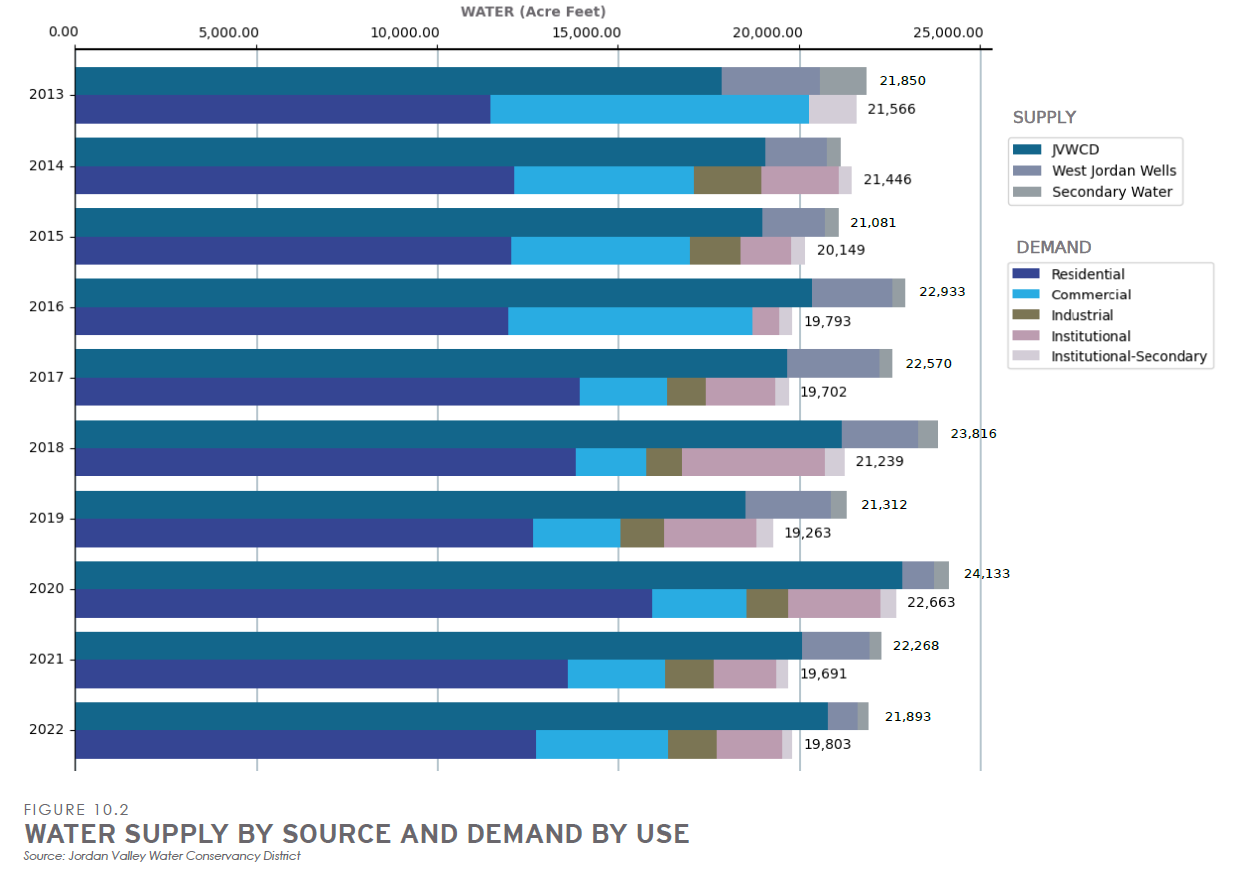
Source: Jordan Valley Water Conservancy District
It is important to note that each type of land use has fluctuating demand for water. Residential demand comprises over half of the total water demand but has remained fairly steady over the last 10 years. Commercial water use was much higher in the early 2010s but has steeply declined since. The demand for industrial and institutional uses has fluctuated from year to year but has seen a relatively substantial increase in the past five years.
Although most of the supplied water in West Jordan is culinary, it is often applied to both indoor and outdoor uses. Generally, outdoor use has comprised more than half of the total supplied water and has been decreasing since 2000 at an average annual rate of 1%.
Outdoor water use occurs between the months of April and November, with peak usage occurring in July and August.
In addition to water supply and demand, infrastructure and serviceability play a crucial role in providing water. During the past decade, the City has struggled to keep up with water pressure tank construction due to increased development and steady growth. The City will need to construct new tanks and supporting infrastructure in many of the water pressure zones of the City before any new developments that increase the density from the current designated land use can be approved. The City is currently constructing a water tank in Zone 3B near the Wight’s Fort Cemetery, two tanks in Zones 5 and 6 within the planned Dry Creek Highlands development west of Bacchus Highway, and one tank within Zone 7 in the southwest corner of the City.
To adequately manage and plan for future demand on the City’s water resources, the West Jordan Water Master Plan has been adopted to assess the available water supply, evaluate the adequacy of the projected water supply to meet projected demands and identify and prioritize system improvements that are needed to resolve anticipated deficiencies in the City’s water service area. The City has also adopted the Water Conservation Plan, which discusses the City’s efforts to reduce water consumption, recommends water conservation measures and sets goals to further reduce water use.
The West Jordan City Code also contains numerous water efficiency and conservation standards such as limiting turf and requiring water efficient irrigation systems that are applied to new development.
The following policies and goals throughout this chapter should be used to help minimize water usage citywide.
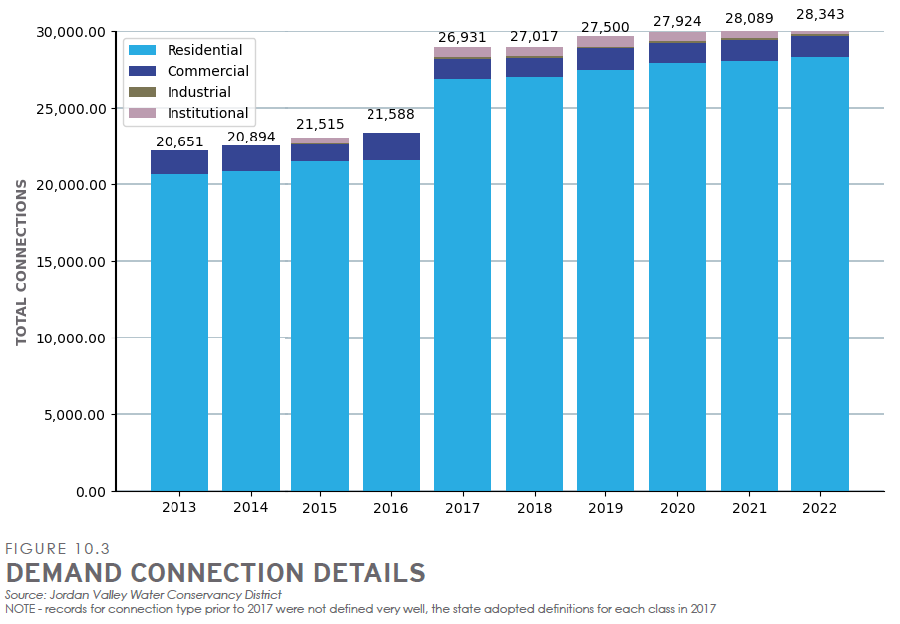
Source: Jordan Valley Water Conservancy District
Statutory Requirements for Water Use and Preservation
The State’s required water preservation standards as defined in Utah Code, §10-9a-403 are addressed in the West Jordan Water Master Plan, the Water Conservation Plan and in the City Code. The following table lists applicable statutory requirements for water use and preservation and states how these standards are or will be met:
Summary of Utah Code Requirement | Subsection of Utah Code § 10-9a-403 | Utah Code Text | Standard Met/In Progress/Not Yet Met |
Summary of Utah Code Requirement | Subsection of Utah Code § 10-9a-403 | Utah Code Text | Standard Met/In Progress/Not Yet Met |
Effect of development on water demand and infrastructure | (2)(a)(iv)(A) Shall include . . . | (A) the effect of permitted development or patterns of development on water demand and water infrastructure; | Standard is met WMP – Effect of development on water demand and infrastructure is detailed in the West Jordan Water Master Plan, Chapter 2. |
Reducing water demand for future development | (2)(a)(iv)(B) Shall include . . . | (B) methods of reducing water demand and per capita consumption for future development; | |
Reducing water demand for existing development | (2)(a)(iv)(C) Shall include . . . | (C) methods of reducing water demand and per capita consumption for existing development; and | |
Opportunities to avoid wasting water | (2)(a)(iv)(D) Shall include . . . | (D) opportunities for the municipality to modify the municipality’s operations to eliminate practices or conditions that waste water. | Standard is met O – City offers information to residents about how they may flip their strips O – City utilizes water-wise landscaping in the development of new facilities and parks |
Applicable regional goals for water conservation | (2)(f)(i)(A) Shall consider . . . | (A) applicable regional water conservation goals recommended by the Division of Water Resources; and | In Progress |
Consider adopting a water conservation plan | (2)(f)(i)(B) Shall consider . . . | (B) if Section 73-10-32 requires the municipality to adopt a water conservation plan pursuant to Section 73-10-32, the municipality’s water conservation plan; [West Jordan City is a “retail water supplier” pursuant to Utah Code Sec. 19-4-102(9), is a “water provider” pursuant to Utah Code Sec.73-10-32(1)(d) (i), & shall adopt and prepare a water conservation plan pursuant to Utah Code Sec. 73- 10-32(3)(a)(i).] | |
Where standard is addressed: GP – General Plan Water Use and Preservation Element; CC – City Code; WMP – Water Master Plan; WCP – 2019 Water Conservation Plan Update; WP – Web page; O - Other | |||
Summary of Utah Code Requirement | Subsection of Utah Code § 10-9a-403 | Utah Code Text | Standard Met/In Progress/Not Yet Met |
Recommendation for water conservation policies | (2)(f)(ii)(A) Shall include a recommendation for. . . | (A) water conservation policies to be determined by the municipality; | Standard is met WCP - 2019 Water Conservation Plan Update. The City has adopted a Water Conservation Plan containing water conservation policies. |
Landscaping options in a parkstrip not requiring lawn/turf | (2)(f)(ii)(B) Shall include a recommendation for. . . | (B) landscaping options within a public street for current and future development that do not require the use of lawn or turf in a parkstrip; | Standard is met CC – Section 13-13-5.I.: Water Efficiency Standards. Lawn/turf is prohibited in new multi- family residential, commercial and industrial developments. |
Recommend City Code amendments to promote water efficiency | (2)(f)(iii) Shall review . . . | (iii) . . . the municipality’s land use ordinances and include a recommendation for changes to an ordinance that promotes the efficient use of water; | Standard is met CC – Section 13-13-5: Water Efficiency Standards. City Code includes water efficiency standards that promotes the efficient use of water. No ordinance changes are necessary. |
Reduction of the use of lawn/turf | (2)(f)(iv)(A) Shall consider . . . | (A) reduction or limitation of the use of lawn or turf; | |
Landscape design to reduce stormwater & irrigation runoff | (2)(f)(iv)(B) Shall consider . . . | (B) promotion of site-specific landscape design that decreases stormwater runoff or runoff of water used for irrigation; | Standard is met CC - 13-13-5: Water Efficiency Standards. Required use of drip irrigation systems in landscape design reduce the amount of water used and therefore the amount of stormwater or runoff water. 13-13-6: Landscape Requirements for Specific Land Uses: On site detention areas are considered part of the landscape area of a site and reduce stormwater runoff by detaining water on site. |
Use of trees with a reasonable water requirement | (2)(f)(iv)(C) Shall consider . . . | (C) preservation and use of healthy trees that have a reasonable water requirement or are resistant to dry soil conditions; | Standard is met and is being strengthened. O – City of West Jordan Approved and Prohibited Tree List contains a list of tree species that thrive naturally in West Jordan’s climatic and soil conditions. |
Summary of Utah Code Requirement | Subsection of Utah Code § 10-9a-403 | Utah Code Text | Standard Met/In Progress/Not Yet Met |
Summary of Utah Code Requirement | Subsection of Utah Code § 10-9a-403 | Utah Code Text | Standard Met/In Progress/Not Yet Met |
Reduction of water features with unnecessary evaporation | (2)(f)(iv)(D) Shall consider . . . | (D) elimination or regulation of ponds, pools, and other features that promote unnecessary water evaporation; | Standard Met O – Regulation of these water features can be found within the Drought Management Plan, last modified January 2022. |
Reduction of yard waste | (2)(f)(iv)(E) Shall consider . . . | (E) reduction of yard waste; and | Standard is met City of West Jordan operates a curbside yard waste recycling program from March to November. |
Use of more efficient irrigation systems | (2)(f)(iv)(F) Shall consider . . . | (F) use of an irrigation system, including drip irrigation, best adapted to provide the optimal amount of water to the plants being irrigated; | Standard is met CC – Section 13-13-5.B: Water Efficiency Standards. Requires the use of drip irrigation or bubbler systems in all new construction. |
Consult with the “public water system” (Jordan Valley Water Conservancy District) | (2)(f)(v)(A & B) Shall consult with .. . | (v) . . . the public water system or systems serving the municipality with drinking water regarding how implementation of the land use element and water use and preservation element may affect: | Standard is met WMP – City of West Jordan purchases water from the Jordan Valley Conservancy District (JVCD) and routinely consults with the JVCD on water supply. The City Landscaping Ordinance was recently updated to incorporate the Water Efficiency Standards from the Jordan Valley Water Conservancy District. |
(A) water supply planning, including drinking water source and storage capacity consistent with Section 19-4-114; and | |||
(B) water distribution planning, including master plans, infrastructure asset management programs and plans, infrastructure replacement plans, and impact fee facilities plans; | |||
Low water use landscaping standards for new commercial & multi-family development | (2)(f)(vii)(A, B, & C) Shall include a recommendation for. . . | (vii) [a] municipality . . . for low water use landscaping standards for a new: | Standard is met CC – Section 13-13-6: Landscape Requirements for Specific Uses. This section contains low water use landscaping standards for new multi-family residential, commercial and industrial development. |
(A) commercial, industrial, or institutional development; | |||
(B) common interest community, as defined in Section 57-25-102; or | |||
(C) multifamily housing project.
| |||
Where standard is addressed: GP – General Plan Water Use and Preservation Element; CC – City Code; WMP – Water Master Plan; WCP – 2019 Water Conservation Plan Update; WP – Web page; O - Other | |||
WATER USE AND PRESERVATION GUIDING PRINCIPLES |
Implement and encourage principles of sustainable water use and water-conserving landscaping |
Encourage water conservation by following the West Jordan Water Conservancy and Drought Plan |
Modify the City’s practices to efficiently manage water and set a positive example for water conservation |