Chapter Two
POPULATION & DEMOGRAPHICS
POPULATION & DEMOGRAPHICS
In order to improve quality of life and opportunities within the community, it is essential to understand changes within the City’s population.
West Jordan was incorporated as a town on January 10, 1941. The first U.S. Census taken for West Jordan in 1950 reported a population of 2,107. Since the 1950 U.S. Census, the population of West Jordan has increased over 56 times to 116,961 in 2020. During this time period, the population of Salt Lake County increased fourfold. A comparison of West Jordan’s growth to Salt Lake County’s growth is illustrated in Figure 2.1.
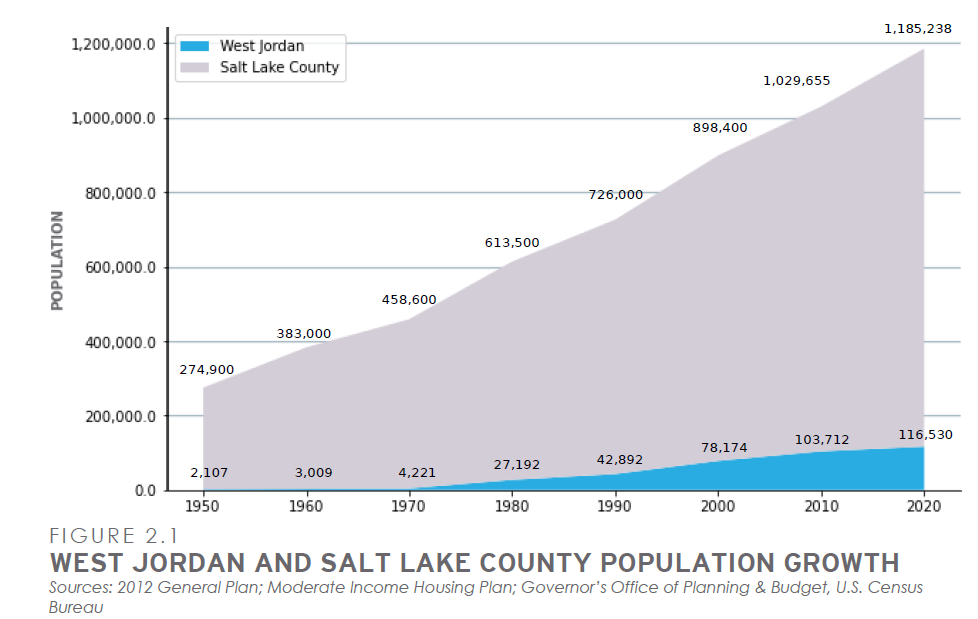
Sources: 2012 General Plan; Moderate Income Housing Plan; Governor’s Office of Planning & Budget, U.S. Census Bureau
As illustrated in Figure 2.2, West Jordan is the third most populous city in Salt Lake County and, according to the 2020 Census, the third most populous city in the entire state of Utah.
Since the 1990 Census, West Jordan has seen a population increase of 167% or an average annual increase of 5.95%. Continued population growth is expected as housing needs in Salt Lake County continue to create demands on undeveloped land within the City’s boundaries.
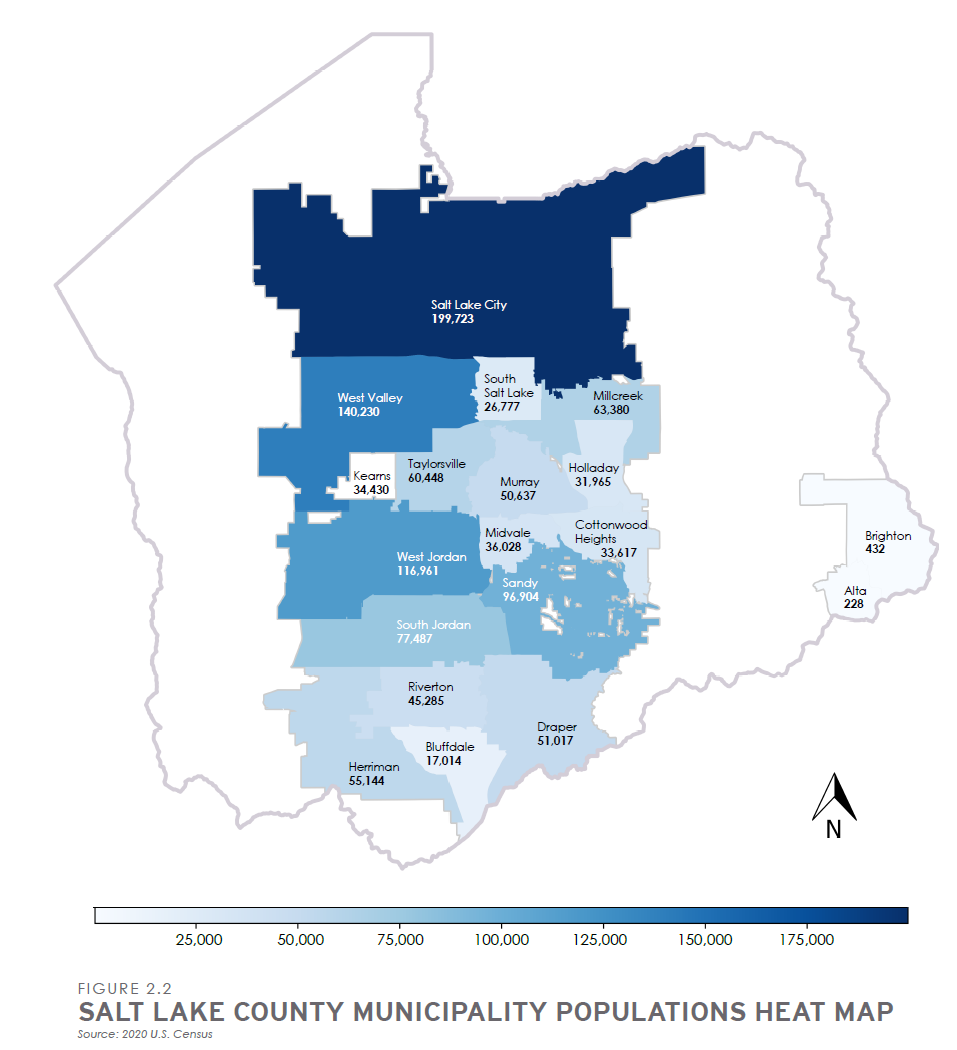
Source: 2020 U.S. Census
Racial & Ethnic Distribution
The largest single racial group within West Jordan is White/Caucasian. The greatest increase in an ethnic minority population has been in the Hispanic segment of the City’s population as shown in Figure 2.3.

Source: 2020 U.S. Census
Age and Education
The median age of a West Jordan resident is 32.3 years old as compared to the median age in Utah, which is 31.2 years old. According to the U.S. Census, 90.6% of residents over the age of 25 are high school graduates, and 22.7% have received a bachelor’s degree or higher. Figure 2.4 illustrates the age distribution of residents and the education level of West Jordan residents over 18 years of age.

Source: On the Map, U.S. Census Bureau
Household Income
West Jordan families enjoy an income level that is higher than in Salt Lake County as a whole (Figure 2.7). According to the 2020 U.S. Census, the median family income in West Jordan is $87,006 compared to $80,119 for all of Salt Lake County. It should be noted, however, that per capita income is lower in West Jordan when compared to Salt Lake County ($29,369 vs. $35,672). This is attributable to the fact that the average family size in the City is greater than that of Salt Lake County.

Source: On the Map, U.S. Census Bureau
Loading...