DEMAND PROJECTIONS
Through the planning window of this study (2060), the City is expected to see significant growth as the City approaches buildout. The United States Census Bureau estimates the population of the City to be approximately 117,000. The Wasatch Front Regional Council (WFRC), which provides population and employment projections, projects that the West Jordan area will increase of nearly 27,000 people from current. Over the past 15 years, the City's population has grown at approximately 1.8% per year. It is assumed that growth will continue at this rate in the near term before slowing as the City approaches buildout.
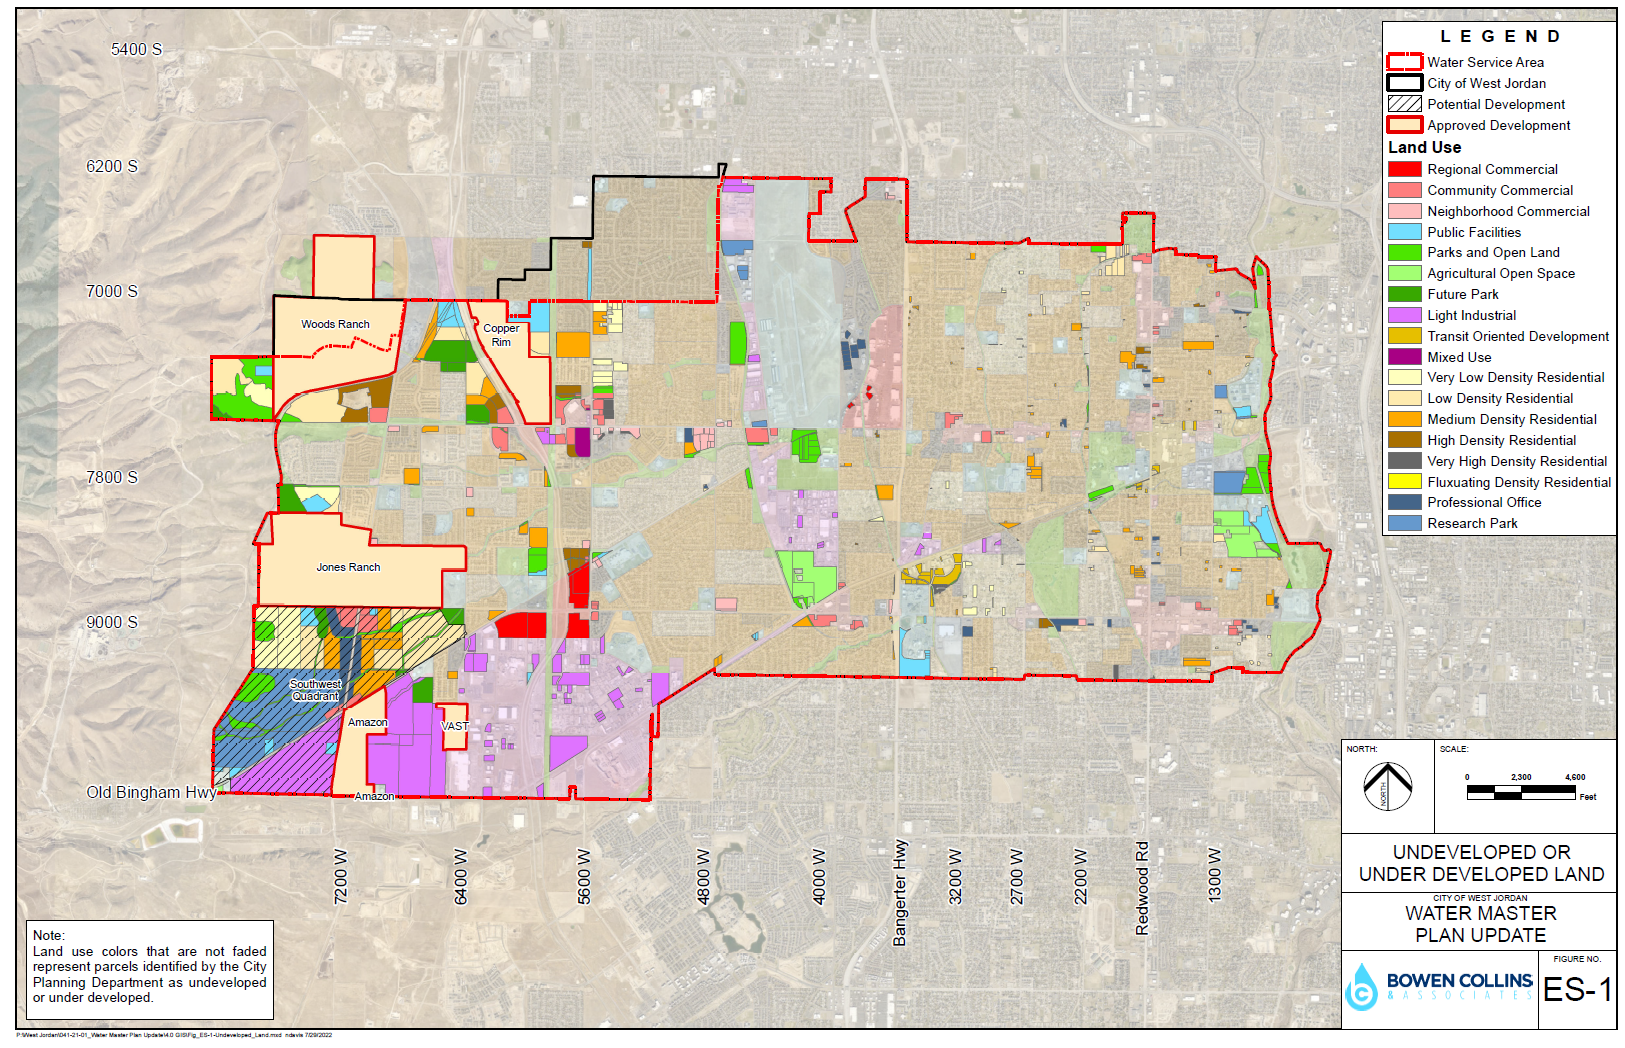
To determine where that growth will occur, City staff provided GIS data detailing undeveloped parcels. That information was combined with the City's current land use map to create a guide for where and how much water demand would increase. Figure ES-1 shows the undeveloped parcels with their assigned land use type, as well as several known developments that will be constructed in the near future.
To plan for water demand, population and employment projections are converted into a common unit, an equivalent residential connection (ERC). An ERC is defined as the equivalent water demand for the average residential water connection. As part of this study, Bowen Collins & Associates (BCA) worked with City staff to determine appropriate ERC densities for various residential and non- residential land use categories. Table ES-1 is a summary of the developable land available and the assumed ERC density associated with it. Based on this analysis, at buildout the water system will have 24,274 additional ERCs. It should be noted that any changes in land use or density assumptions can have significant impacts on the water system. Each ERC has an associated water source, pumping, conveyance and storage capacity associated with it.
Land Use Category | Developable Acreage | Assumed Density (ERC/Acre) | Additional ERCs |
Land Use Category | Developable Acreage | Assumed Density (ERC/Acre) | Additional ERCs |
Generally Established Densities | |||
Community Commercial | 109 | 2.2 | 239 |
Neighborhood Commercial | 54 | 1.8 | 98 |
Parks and Open Land | 341 | 2.1 | 716 |
Professional Office | 102 | 2.6 | 265 |
Public Facilities | 176 | 2.4 | 423 |
Regional Commercial | 3 | 1.9 | 6 |
Research Park | 352 | 1.5 | 529 |
Transit Oriented Development | 39 | 20.0 | 773 |
Very Low Density Residential | 211 | 2.0 | 421 |
Low Density Residential | 317 | 3.0 | 950 |
Medium Density Residential | 331 | 5.4 | 1,784 |
High Density Residential | 46 | 8.0 | 365 |
Very High Density Residential | 16 | 16 | 258 |
Jones Ranch | 610 | 4.9 | 2,960 |
Copper Rim | 177 | 3.5 | 618 |
Woods Ranch | 193 | 4.7 | 912 |
Variable Density | |||
Light Industrial | 632 | 3.1 | 1,984 |
Interchange Overlay Zone | 375 | 29.3 | 10,974 |
TOTAL | 24,274 | ||
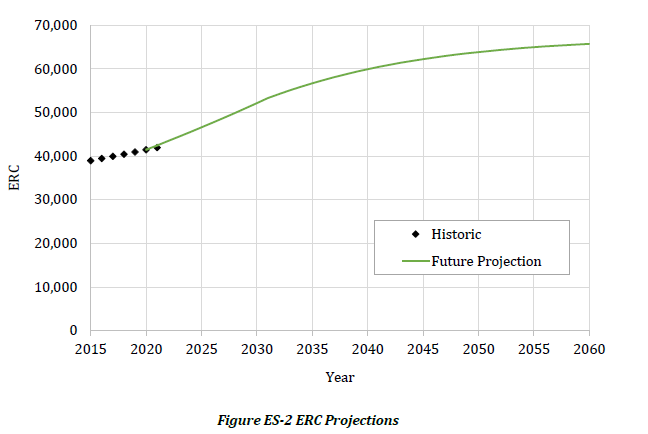
Based on historic ERC counts and City Staff's tracking of planned developments over the past several years, it is estimated that in 2021 the City had an existing ERC count of 41,976. Adding the current and projected ERCs gives a buildout projection of 66,250. Figure ES-2 shows the expected increase in ERCs over time.