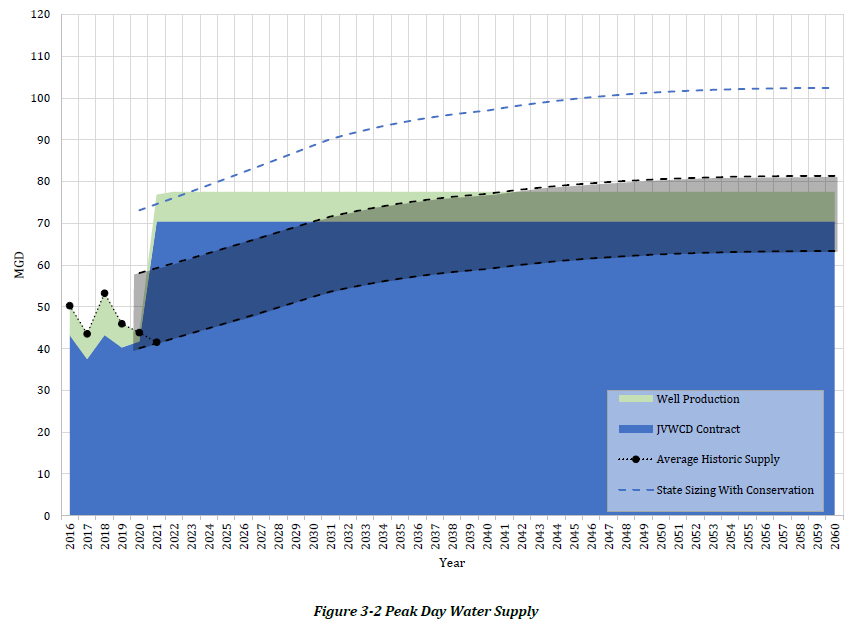
In addition to meeting annual demand volumes, the City's water system will also need to be capable of delivering water at capacities sufficient to satisfy peak demands. Figure 3-2 shows the projections discussed in Chapter 2 with the supply availability. Table 3-5 summarizes this data for select years.

Year | JVWCD Contract (MGD) | Well Production (MGD) | State Sizing Requirement (MGD) | Surplus / (Deficit) (MGD) |
2021 | 70.5 | 7.1 | 74.6 | 3.0 |
2026 | 82.3 | (4.7) | ||
2031 | 90.2 | (12.6) | ||
2041 | 97.7 | (20.1) | ||
2051 | 101.6 | (24.0) | ||
2060 | 102.4 | (24.8) |