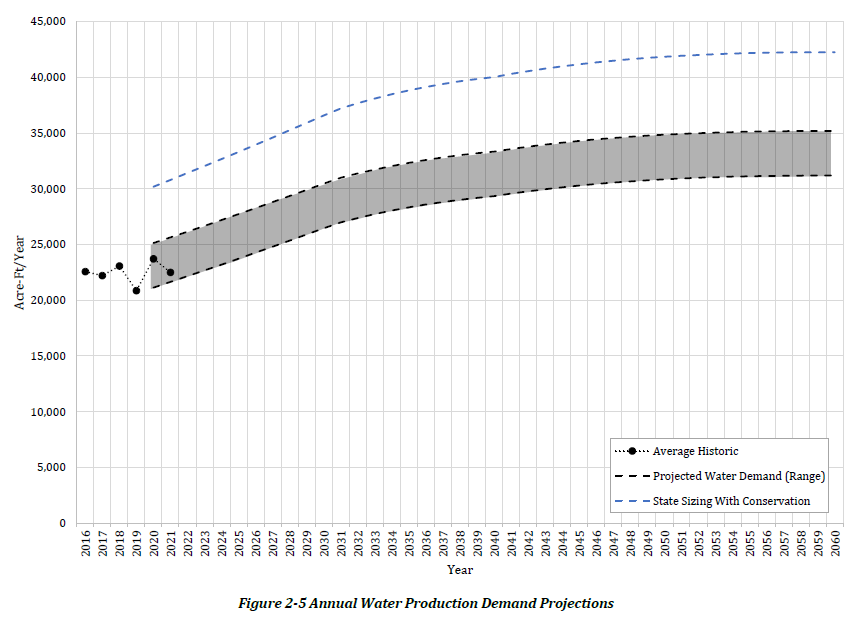
Based on the several factors discussed above, Figure 2-5 shows the annual demand projections for the City. Included in this figure are several potential variations in demand depending on the scenario of interest:
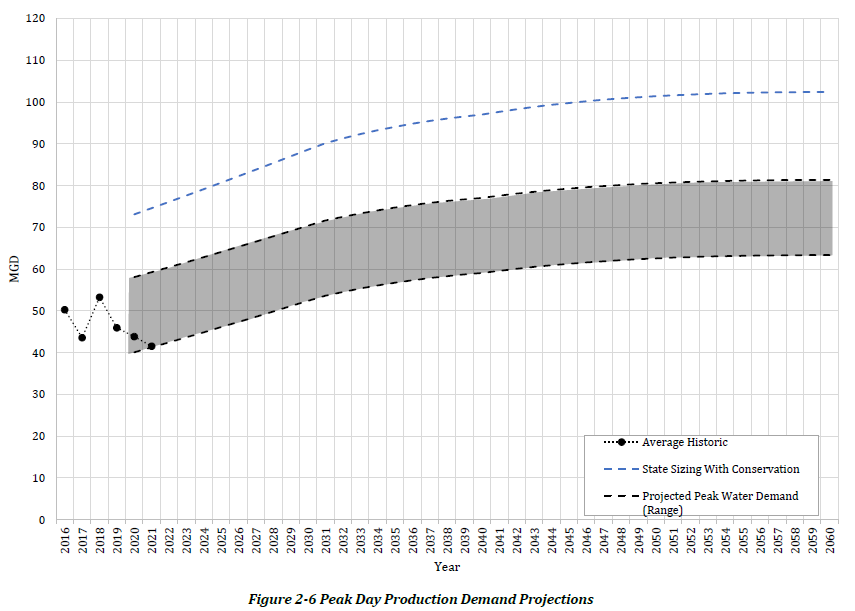
• Demand at the State of Utah Sizing Standard (includes recommended reliability factor)
• A range of projected actual water use, which does not include the reliability factor. The range is helpful due to year-to-year variation caused by varying conditions such as wet or dry years or temporary drought restrictions.
• Both projections include conservation in future years
Figure 2-6 shows the peak day demand projections for the same scenarios. Which scenario to plan for will vary depending on circumstances and will be discussed in subsequent sections of this report.

