BC&A reviewed the WFRC TAZ projections for the City of West Jordan and used the existing population estimates and growth rates for each TAZ within the City to help define the rate of growth for the existing service area through the year 2050. The WFRC does not have population projection beyond the year 2050, so the rate of growth shown through 2060 is extrapolated at the 2050 rate for the existing service area.
The WFRC TAZ projections show a slow and fairly steady growth rate of 0.6% over the next 40 years. Unfortunately, this does not appear to be representative of recent observed growth trends. Over the past 15 years, the West Jordan population has grown at approximately 1.8 %. To ensure that the water system is ready and available when needed, BC&A and City staff identified a slightly higher planning growth rate for population projections. The recommended growth rate follows the higher historic growth rate of 1.8% over the next few years, and then gradually slows to match the total growth shown in the TAZ projections at the 40-year mark. This allows the projections to match regional expectations in the long-term while better reflecting observed trends in the short-term.
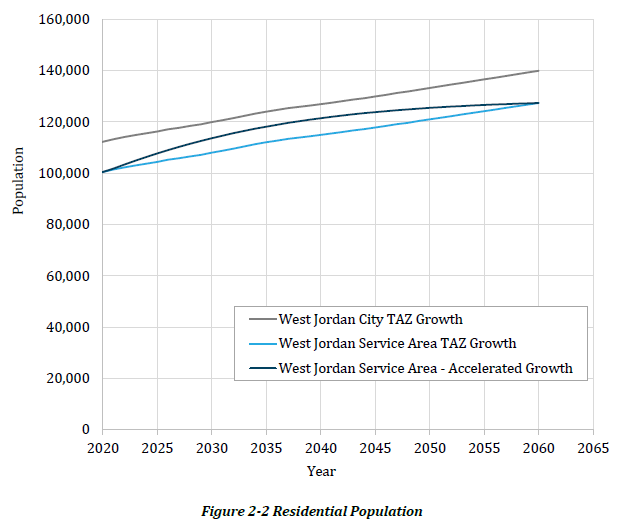
Table 2-1 and Figure 2-2 identify the population projections for the City service area.
West Jordan City TAZ Projection | West Jordan Service Area - TAZ Projection | Average Growth Rate | West Jordan Service Area - Accelerated Projection | Accelerated Growth Rate |
West Jordan City TAZ Projection | West Jordan Service Area - TAZ Projection | Average Growth Rate | West Jordan Service Area - Accelerated Projection | Accelerated Growth Rate | |
2020 | 112,212 | 100,428 | 100,428 | ||
2025 | 116,228 | 104,374 | 0.77% | 107,677 | 1.40% |
2030 | 119,928 | 108,023 | 0.69% | 113,617 | 1.08% |
2035 | 123,948 | 112,026 | 0.73% | 118,130 | 0.78% |
2040 | 126,873 | 114,898 | 0.51% | 121,435 | 0.55% |
2045 | 129,890 | 117,820 | 0.50% | 123,792 | 0.39% |
2050 | 133,208 | 120,970 | 0.53% | 125,441 | 0.26% |
2055 | 136,554 | 124,164 | 0.52% | 126,579 | 0.18% |
2060 | 139,899 | 127,357 | 0.51% | 127,357 | 0.12% |