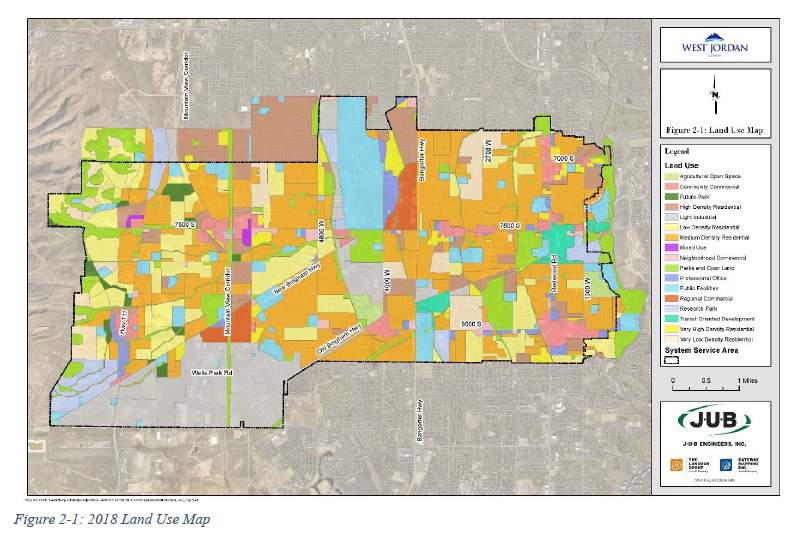
The City's most current GIS parcel data, aerial photographs, and 2018 Land Use Map (Figure 2-1) were used to identify residential, commercial, industrial, and light industrial areas of the City. See Appendix A for the large-scale figure.
The wastewater flows from these areas were then individually assigned to the wastewater model. The 2018 population estimate used information from the University of Utah Kem C. Gardner Institute for residential dwelling unit densities and occupancy rates (people per household). The current citywide residential dwelling units per acre is 1.66. The City population for 2018 from the University of Utah Kem C. Gardner Institute was 111,719.
Density Designation | Current Density Range (Dwelling Units Per Acre) |
Very Low Density | Up to 2.0 |
Low Density | 1 to 3 |
Medium Density | 3.1 to 5.0 |
High Density | 5.1 to 10 |
Very High Density | 10.1 and up |
Density Designation | Density Range (Dwelling Units Per Acre) |
Very Low Density | Up to 2.0 |
Low Density | 1 to 3.5 |
Medium Density | 3.1 to 7.6 |
High Density | 5.1 to 14.1 |
Mixed Use | 0-25 |