In recent years, urban sprawl is beginning to encroach upon parts of Hancock County. As recent as the 2010 census data, Hancock County was the 3rd fastest growing county in the Indianapolis metro area just behind Hamilton and Hendricks counties. In the past decade alone, the western part of Hancock County has seen dramatic growth in the towns of McCordsville (4,797; +323.0%), Fortville (3,929; +14.1%) and Greenfield (20,602; +41.1%). Only the town of Cumberland (5,169; -6.0%), showed a negative growth.
The Town of New Palestine (2,055; +62.6%), which has seen the second highest growth rate the county, is beginning to feel the impending pressure from developers. This is not only the story of New Palestine, but also of many other communities located across the nation which are in fairly close proximity to a large growing urban area.
HISTORY
Background
Hancock County, named after John Hancock, first signer of the Declaration of Independence, was separated from Madison County and organized in 1828.
The 1828 county organization resulted in three townships—Blue River, Brandywine, and Sugar Creek. New townships were created until 1850 when the county was divided into thirteen parts. In 1853 the county commissioners reduced the number of townships to the present nine.
Low, wet land areas slowed the growth of some parts of Hancock County until the use of tile ditching became widespread after the Civil War. This wet topography probably accounted for the relatively small Indian population. The Delaware had villages in Brandywine and Sugar Creek Townships.
Since Hancock County lacked travel routes by navigable waterways, traces and early roads were important to settlers. Blue River is the largest stream, but it only passes through the southeastern corner of the county. It was used not only as a route for early settlement, but also as power for small mills. Sugar Creek, Brandywine Creek, Buck Creek, and other small streams also had mills. Among the early roads were Napoleon's Trace and the old State Road which wound through the central section of the county. The Brookville Road (now U.S. 52), the National Road (now U.S. 40), and various pikes were even more influential on population growth and economic development.
Population increased tremendously following World War II as the automobile allowed easier access to jobs in Indianapolis and Anderson for commuters who enjoyed the rural, suburban setting of Hancock County. This has led to the establishment of New Palestine as a "bedroom community" today.
Founding Father
Jonathon Evans, known as the founder of New Palestine, accumulated several acres of land and established a general store. A Delaware Indian village had been located nearby, and several cabins, inns, and businesses preceded the town survey.
Beginning in 1828 German immigrants settled in the area around what was to become New Palestine and developed prosperous farms and businesses. A new school, some churches, and several commercial buildings reflected the influence of these new citizens.
Jonathan Evans platted New Palestine in October of 1838 on the old Brookville Road which is now. U.S. 52. The original plat contained 15 blocks and 36 lots. He later bought 240 acres from the heirs of Amos Dickerson which became the Evans 2nd Addition to the Town on the west side of Bittner Street. The Junction, or better known as the Cincinnati, Hamilton, and Dayton Railroad was completed in 1869 and formed the northern border of the town. The town was incorporated on May 22, 1871 with a population of 279.

Mr. Evans opened a small his general store in 1838. The small primitive department store consisted of everything from dry goods to livestock. The post office occupied one corner of the store and was attended by Mr. Evans younger sons. It was located at the southeast corner of Main and Bittner Street where the original building still stands (oldest in the town), most recently known as Bonnie Scott's cafe.

A quiet town for the most part, New Palestine has not gone without its share of excitement. The Temperance movement was strong in the area, and a saloon and a poolroom were blown up in 1881 and 1882. The town hall was destroyed in an accidental gas explosion in 1906 and in which many records of the past were lost forever.
New Palestine has grown rapidly in recent years and Sugar Creek Township, of which New Palestine is the largest town, is the fastest growing area in Hancock County.
New Palestine Comprehensive Development Plan / 2016-2035
HISTORIC STRUCTURES
Interim Report
In 1983 a grant for this survey and Interim Report was provided by the Indiana Department of Natural Resources, Division of Historic Preservation and Archaeology, using grant monies for planning and surveys from the U.S. Department of the Interior, National Park Service. Matching funds were provided by Historic Landmarks Foundation of Indiana. Hancock County was one of five counties selected jointly by the Indiana Department of Natural Resources, Division of Historic Preservation and Archaeology, and Historic Landmarks Foundation of Indiana.
A comprehensive field survey was begun in June of 1981 under the local sponsorship of Greenfield Historic Landmarks, Inc. Architectural and historical field documentation was compiled by Alan Conant, Liese A. Hilgeman, Mark A. Miles, Sheryl D. Roberson, and Deirdre Spencer. Mary Lou Poe served as Historical Consultant. Samuel A. Roberson & Associates compiled the data and prepared the material for this publication. As a result of the survey, a total of 1023 sites and structures were entered into the final inventory. Of this total, 64 entries were grouped into three multiple resource areas; 585 entries were listed in three historic districts; and the remaining 374 were listed under nine county townships and two scattered site areas. From this field data the Hancock County Interim Report was compiled for publication.
The inventory for New Palestine is listed below along with a map showing the locations.
Map and Inventory

Italicized material indicates demolished since report published in 1983
Number | Rating | Description | Location | Architectural Style | Date Built | Historic Significance |
Number | Rating | Description | Location | Architectural Style | Date Built | Historic Significance |
1 | C | House | 29 North St | Bungalow | c. 1920 | Architecture |
2 | C | Grain Elevator | Mill St | 20th Century Functional | c. 1900 | Architecture , Commerce |
3 | C | House | Mill St | Carpenter-Builder | c. 1900 | Architecture |
4 | C | House | Mill St | Carpenter-Builder | c. 1900 | Architecture |
5 | C | House | Mill St | Carpenter-Builder | c. 1900 | Architecture |
6 | C | House | 33 Mill St | Carpenter-Builder | c. 1890 | Architecture |
7 | C | House | 31 Mill St | Carpenter-Builder | c. 1890 | Architecture |
8 | O | Methodist Episcopal Church | Mill St | Romanesque Revival | c. 1901 | Architecture , Religion |
9 | C | House | 24 Mill St | Carpenter-Builder | c. 1890 | Architecture |
10 | C | House | 23 Mill St | Carpenter-Builder | c. 1890 | Architecture |
11 | N | House | 129 E Main St | Bungalow | c. 1920 | Architecture |
12 | O | House | 110 E Main St | Greek Revival | c. 1840 | Architecture |
13 | C | House/Commercial | E Main St | Greek Revival/Victorian | c. 1838/18 90 | Architecture , Commerce |
14 | C | Commercial Building | 47 E Main St | Victorian Functional | c. 1900 | Architecture , Commerce |
15 | C | House | 20 S Bittner St | Carpenter-Builder | c. 1890 | Architecture |
16 | C | Commercial Building | S Bittner St | Victorian Functional | c. 1900 | Architecture , Commerce |
17 | N | House | 37 E Main St | Italianate | c. 1880 | Architecture |
18 | O | Commercial Building | 28 E Main St | Italianate | c. 1880 | Architecture , Commerce |
19 | O | Commercial Building | 11 W Main St | Italianate | c. 1890 | Architecture , Commerce |
20 | O | High School | Larabee St | Neo-Classic | c. 1919 | Architecture , Education |
21 | N | House | 23 W Main St | Eastlake | c. 1890 | Architecture |
22 | N | North Christian Church | W Main St | Modern | c. 1970 | Architecture , Religion |
23 | O | S.H. Elverson House | 26 W Main St | Italianate | c. 1870 | Architecture |
24 | N | House | 28 W Main St | Italianate | c. 1890 | Architecture |
25 | C | House | 37 W Main St | Bungalow | c. 1930 | Architecture |
26 | C | House | S Andrew St | Carpenter-Builder | c. 1910 | Architecture |
27 | N | House | 37 Larabee St | Colonial Revival | c. 1940 | Historic District |
28 | C | House | Larabee St | Carpenter-Builder | c. 1900 | Architecture |
DEMOGRAPHICS
Population
The population of New Palestine remained fairly steady from 1910 up to 2000. Shown below is the historic population from 1900 to 2010.
Historic Population Town of New Palestine
YEAR | 1910 | 1920 | 1930 | 1940 | 1950 | 1960 | 1970 | 1980 | 1990 | 2000 | 2010 |
POPULATION | 450 | 442 | 456 | 448 | 504 | 725 | 863 | 749 | 671 | 1,264 | 2,055 |
#Increase/ Decrease | -8 | 14 | -8 | 56 | 221 | 138 | -114 | -78 | 593 | 791 | |
% Increase/ Decrease | 1.7%
|
3.2% | 1.7% | 12.5 % | 43.8 % | 19% | 13.2 % | 10.4 %
|
88.4 % | 62.6 % |
Since the earliest population count in 1910 of 450, the highest population that the Town of New Palestine has witnessed was 863 in the 1970's. In the 1990's all of that changed and the Town saw an 88.4% increase that put the Town's population over the 1,000 mark for the first time for the 2000 census. The following decade showed another large increase in population by 62.6% to reach its highest population to date of 2,055 in 2010.
By contrast, Hancock County has seen an increase in population since the 1940's. The highest increase Hancock County has seen was in the 2000's at an increase of 26.4%. Hancock County's increase has been mostly attributed to the suburban sprawl and growth of towns on the west side of the county just across the border from Indianapolis. For instance, the Town of McCordsville, which lies north of New Palestine, saw its population increase from 1,134 in 2000 to 4,797 by 2010, an increase of over 300%! The towns of Fortville and Cumberland have also increased dramatically in population.
Sugar Creek township in which New Palestine is located is the second most populous in Hancock County at 14,920. It trails only Center township (location of the county seat) at 25,819.
By contrast, the State of Indiana from 1950 to 2010 had an average increase of only 15.5%. The Town of New Palestine was much greater than the statewide increase at over 300% from 1950 to 2010!
Population by Gender
Shown below is the population in the Town of New Palestine by gender. There is a higher percentage of women in New Palestine which is comparable to the State of Indiana and the U.S.
Population by Gender Town of New Palestine 2010 U.S. Census | ||||
Category | Number | Percent of Total | ||
New Palestine | New Palestine | County | State | |
Male | 1,024 | 49.8% | 49.1% | 49.2% |
Female | 1,031 | 50.2% | 50.9% | 50.8% |
Total | 2,055 | 100.0% | 100.0% | 100.0% |
Population by Age
Shown below is the breakdown by age group for the Town of New Palestine. As can be seen by comparing it to the percentage for Indiana and Hancock County, as a whole, the Town of New Palestine has a much lower percentage of pre-school age persons and a much higher percentage of senior age persons. It also has a higher percentage of school age persons, but a lower percentage of adults of working age. The median age of persons living in New Palestine is 37.2 years as compared to Hancock County at 39.1 and Indiana at 37.
Population by Age Town of New Palestine 2010 U.S. Census Number | ||||
Category | Number | Percent of Total | ||
New Palestine | New Palestine | County | State | |
Population by Age Town of New Palestine 2010 U.S. Census Number | ||||
Category | Number | Percent of Total | ||
New Palestine | New Palestine | County | State | |
Under 5 years | 118 | 1.5% | 6.3% | 6.7% |
5 to 19 years | 527 | 25.7% | 22.1% | 21.2% |
20 to 64 years | 1,153 | 56.0% | 58.8% | 59.2% |
65 years and over | 257 | 16.8% | 12.8% | 12.9% |
Total | 2,055 | 100.0% | 100.0% | 100.0% |
Population Projection
In order to plan for future land use in the Town of New Palestine, it was necessary to determine the population projection for the planning period.
It is not enough to only examine the current population's needs and conditions. To be effective, decisions made today must consider changes that will take place in the future. Changes in population have an effect not only on the level of community services and facilities that must be provided but also on the type and amount of private investment that occurs in a community. All projections are based on a variety of assumptions. For that reason, ranges of projections are often developed to give higher and lower estimates based on different scenarios. Having knowledge of the community can help to decide which projection is most likely, but it is important to keep in mind that no projection is foolproof. In particular, one should note that the longer the time interval of the projection and the smaller the geographic area under consideration, the greater is the chance for inaccuracy.
The last two decades have shown large percent changes in the population of New Palestine. From the 1990's to 2000, there was an 88.4% increase and 2000 to 2010 showed an increase of 62.6%. This increase in population can be correlated to several factors, but housing units built and any annexations during this time period are two very real factors for population increases in any community. In 2015, the State laws concerning annexation changed making it extremely difficult for communities to annex areas into their corporate limits. Voluntary annexations of undeveloped land will be the main source of any type of growth for many communities. There are several large subdivisions outside the limits of New Palestine. These subdivisions are mostly on septic systems or tied to other sewer systems. The likelihood of the Town annexing these areas of population is very slim.
Population Projections (STATS Indiana data resource)
2010 | 2015* | 2020* | 2025* | 2030* | 2035* |
2010 | 2015* | 2020* | 2025* | 2030* | 2035* | |
Indiana |
6,483,802 | 6,677,751 | 6,852,121 | 7,011,039 | 7,143,795 | 7,248,772 |
% change | 2.9% | 2.6% | 2.2% | 1.9% | 1.4% | |
Indianapolis MSA** |
1,703,036 | 1,814,858 | 1,918,944 | 2,017,459 | 2,108,439 | 2,190,840 |
% change | 6.5% | 5.7% | 5.2% | 4.5% | 3.9% | |
Hancock County |
70,002 | 76,237 | 81,796 | 87,060 | 91,967 | 96,335 |
% change | 8.9% | 7.3% | 6.4% | 5.6% | 4.7% | |
New Palestine*** | 2,055 | 2,187 | 2,577 | 2,967 | 3,298 | 3,629 |
% change | 6.0% | 15.1% | 13.1% | 10.0% | 9.1% | |
* - estimated ** - includes Marion, Hamilton, Boone, Hendricks, Morgan, Johnson, Hancock counties *** - based on proposed and possible housing units | ||||||
NATURAL ENVIRONMENT
Topography and Soils
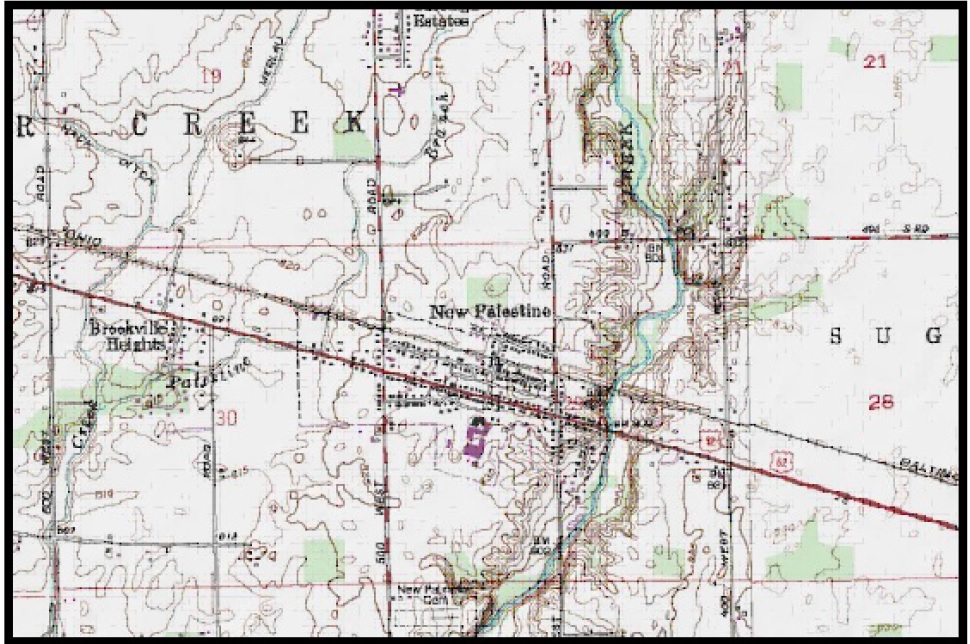
Topography
The Planning Area has a topography that is somewhat flat with drops only surrounding the areas around the Sugar Creek. The map shown below shows the topographical map of New Palestine and outlying areas.
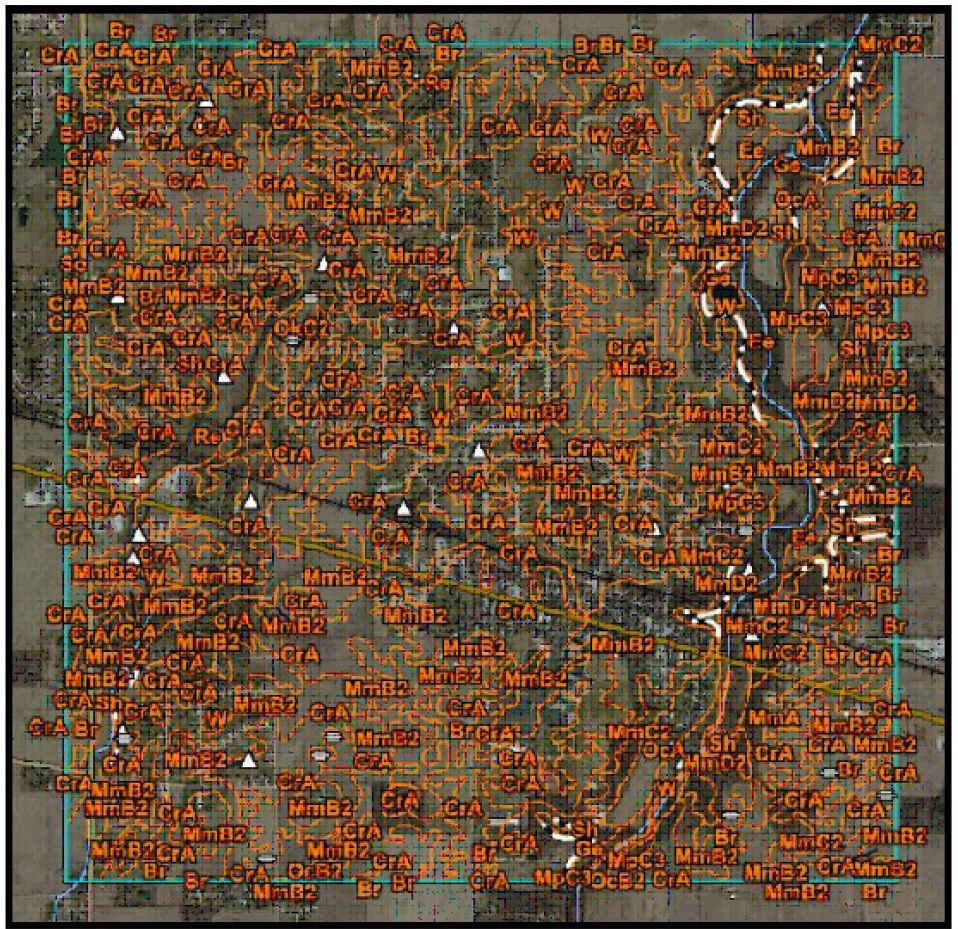
Soils
The soils in the area are predominantly of the Crosby (39%) and Brookston (30%) silty loams. Both of these soil types have poor drainage capabilities. We have included a general soil map of the New Palestine area.
Wetlands
The Feder al gover nment defin es wetla nds as areas with hydri c soil (soil formed in the presenc e of water), and water at or near the grou nd surfa ce long enou gh in the growing seaso n to supp ort hydr ophytic veget ation. Wetl ands are consi dered the single most productive type of wildlife habitat in the United States.
Several types of NWI wetlands are found in the Planning Area. Wetlands in the area consist of seasonally, temporarily and semi permanently flooded areas. In the map below, we show the wetland identified in the National Wetlands Inventory within the Planning Area.

Hydrogeological Characteristics
Outstanding State Resources Waters, Exceptional Use Streams and Natural and Scenic Rivers
There are no outstanding state resources waters, limited use streams, exceptional use streams, or natural and scenic rivers in New Palestine.
Floodways
The Federal Emergency Management Agency (FEMA) completes comprehensive flood studies for the Planning Area. These studies use standard hydrologic and hydraulic computer models to find out the potential flooding from each riverine flooding source.
FEMA defines a "floodway" and a "floodway fringe" within their modeling and flood management system. A floodway is the channel of a stream and adjacent floodplain area that must be kept free of encroachment to carry the 100-year flood without substantial increases (> 0.1 ft.) in flood height. The floodway fringe is the area between the floodway and the natural 100-year floodplain boundary. The floodway fringe could be completely obstructed without increasing the water surface elevation of the 100-year flood.
In the Planning Area, there are several Flood Hazard Areas as determined by the FEMA FIRM maps.
